FontysICT-sem1
The Debugger
Activity: Getting to know Visual Studio’s debugger
Introduction
In software development, testing and bug fixing take more time than actually writing code. With a debugger, you can’t debug but only locate errors.A debugger consists of a collection of tools that allow you to set breakpoints (stop points), and apply stepping (step-by-step execution). Also, you can inspect variables and you can view the call stack and many other aspects.

Assignment
In this tutorial you are going to explore some of the features of the debugger.Create a Console Application project. Name the project “Debugging.”
DEBUG TOOLBAR
In Visual Studio, open the View > Toolbars menu. You will then see all the toolbars available to the user. Make sure Debug is checked. Then you will get the toolbar below.

The drop-down menu next to the Breakpoints button contains the option to have more or fewer buttons visible in the toolbar.For example, uncheck “Show/Hide Thread ”.
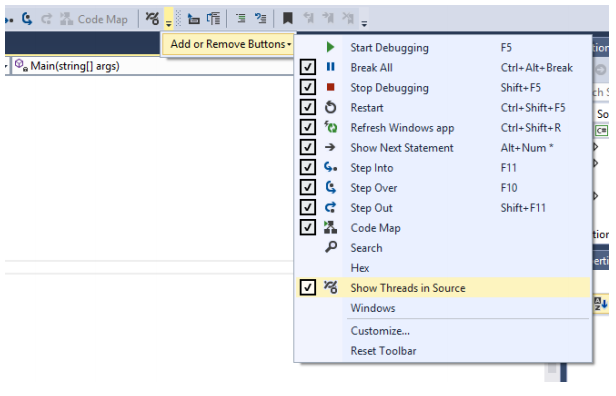
As you can see, the hotkeys are also displayed in this menu. In Visual Studio’s Solution Explorer, double-click on “Program.cs” to open this file. You will then see the code of the class “Program” in the editor.
Type the following code in the “Main ”method (between the curly braces)
string[] names = { “name1”, “name2”, “name3”, “name4”, “name5”, “name6” };


foreach(string name in names)

Console.WriteLine(name);

Console.ReadLine();
What happens when this code is executed? Describe it before you run the program.
Pressing the Start button has the same effect as F5. The application runs after any build.

Stop Debugging stops the debugger from running and returns to the design environment.

Restart is the restart of the debugger from the beginning, all variables are reset.

Move the cursor to the line Console.WriteLine(name); and press F9. You will now see a BreakPoint appear in the margin (The red dot).

Now when you run the program it pauses at the BreakPoint. This line is not executed yet. You can see that the line is now colored yellow and a yellow arrow points to the line that has not yet been executed.

Step Into lets you step through the code line by line. This means you can also go into a method being called.

Step through this code with F11. In the Command Window you will see the result of this displayed.
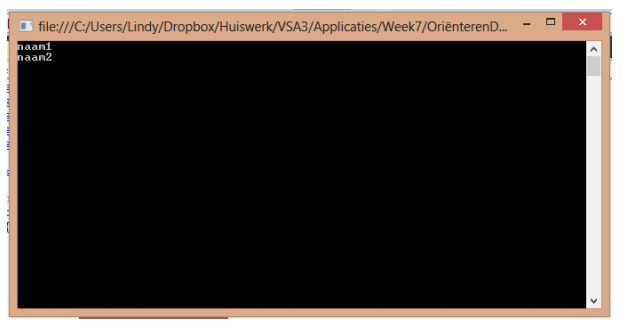
Step Over also lets you walk through the code step by step but does not go into the methods.This is useful if you only want to see the result of a method. That is our code cannot be viewed, as we do not call any other method.

Step Out is useful if you want to stop running through a method. You need it when you’ve run into a system function. But you can also use this button if you just want to get to the next statement quickly.

Continue is useful if during debugging you have seen what you need to see. So if you have already seen that things are going well. If you click Continue the debugger goes to the next breakpoint or to the end of the program if there is no more breakpoint.

Breakpoints
BreakPoints are very important in debugging. You can also set a BreakPoint by clicking once on the gray vertical bar on the left side of your screen.
BreakPoints opens the BreakPoint Window and integrates it with other windows at the bottom of the Visual Studio environment. This window contains information about all BreakPoints currently set.
In your program, also set another BreakPoint to method name “Main” and view the BreakPoints Window.
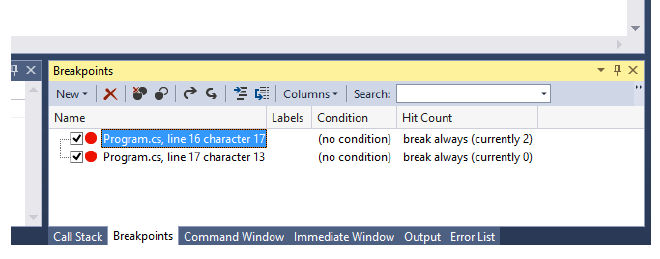
In the BreakPoints Window you will then see displayed where the breakpoint is in your code.
MENU DEBUG
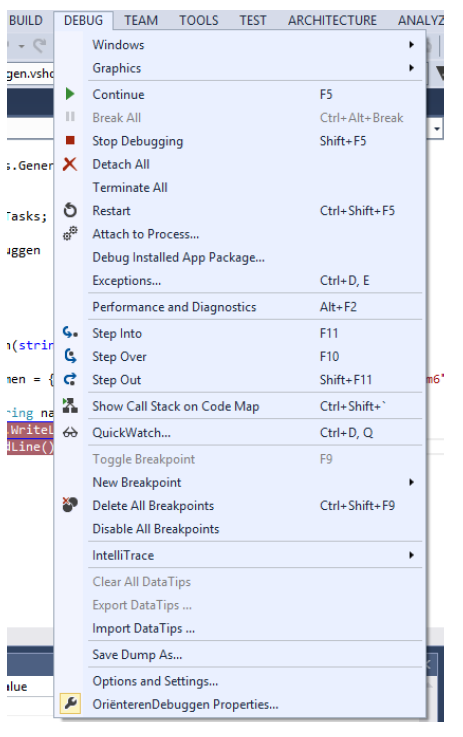
The Visual Studio Debug menu contains all of the above selections for those who prefer to work with menus rather than toolbars.
WATCH WINDOWS
There are a number of windows at your disposal to view the program’s variables. Until now, we saw the BreakPoints Window displayed at the bottom of the IDE. With the arrow next to the BreakPoints icon in the toolbar you get a dropdown menu with other options.
But also this menu comes if you choose Windows under Debug.
Note that you only get to see all the options if you are at a breakpoint.
There are different types of windows such as Autos, Local, etc.
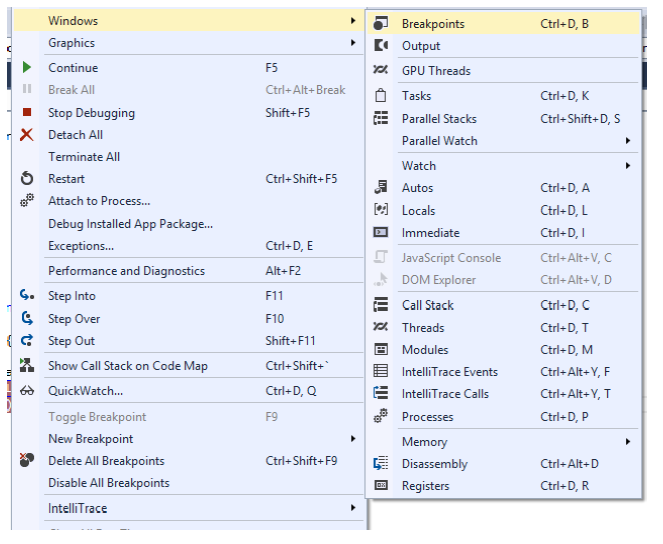
If your program pauses at a BreakPoint you can use such a window to inspect, for example, the values of the current object or variables. A nice option is also the mouse hover, if you hover over the variable with the cursor you also get to see the information of the variable via a ToolTip.
LOCALS
This screen automatically shows the list of variables within the scope of a method.
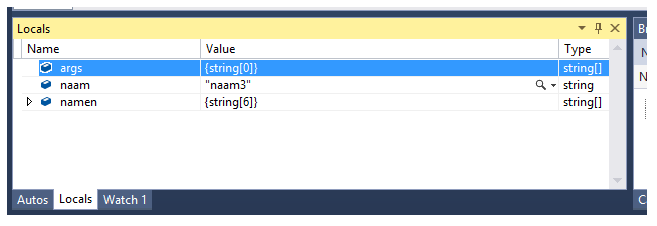
What happens when you press the Hex button on the Debug toolbar?
AUTOS
This window displays the variables where the debugger is and the variables in the statement what is before it.
WATCH
In this window you can add variables you want to view. You do this by right-clicking on the variable and then choosing “Add To Watch”. You can also drag the variables into the window.
To try this out, add some code to your program. Replace the line ``Console.ReadLine();` in the Main method with:
int temp = 4;

for (int i = 0; i < 10; i++)

{

if (i > 5)

temp = 5;

Console.WriteLine(temp);

}

Console.ReadLine();
What happens when this code is executed? Describe it before you run the program.
Add the variable temp to the Watch screen and track the value of this variable as you run through the code using the step function.
CALL STACK
Call Stack information can be important to figure out how a program ended up in a particular piece of code.
If you called multiple methods and want to see if the nested methods are called then the Call Stack is needed.
Put the code below in the program outside the Main method. Do you understand how this code works?
public static void Method1()

{

Console.WriteLine(“This is method1”);

Method2();

}


public static void Method2()

{

Console.WriteLine(“This is method2”);

Method3();

}


public static void Method3()

{

Console.WriteLine(“And this is method3”);

Console.ReadLine();

}
Replace all the code in Main method (i.e., between the braces) with a call to Method1. So by the code Method1();`
You have now created nested method calls. Method1 is called in the Main method. Then Method1 calls Method2 after a WriteLine statement. The Method2 in turn calls Method3 after a WriteLine statement. Method3 first has a WriteLine-statement and then waits for a key to be pressed.
The Call Stack shows up to a BreakPoint nesting. Put a BreakPoint at the call of Method1 and walk through the code with the debugger and see how the Call Stack shows the calls.
If you click on a row in the Call Stack, you will see the corresponding code turn green in the code.
Get used to using the debugger yourself. In the long run, it takes less time to detect errors.
Continuing in .NET6
- Debugging in .NET 6 / Nov2021: pretty useful tips on how to debug in Visual Studio. Definitely useful, because as a developer you spend considerably more time debugging and fixing bugs than writing them :^) If you skipped to 9:00 or so, you can skip the whole introductory round of presenters and get straight into the depths. The audio is a little broke at times, but the tips are top-notch.
Versions:
-
20211129 Tip from Ruben
-
20150601 Marcel Veldhuijzen (KAL, week 5, OIS11)
-
20150125 Marcel Veldhuijzen (Canvas)
-
20140218 Bas Michielsen 2012